Historical Tide Gauge Measurements
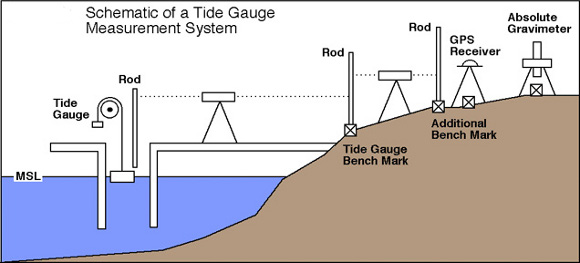
Traditionally, global sea level change has been estimated from tide gauge measurements collected over the last century. Tide gauges, usually placed on piers, measure the sea level relative to a nearby geodetic benchmark. The figure below is the most commonly used tide gauge measurement system, a float operating in a stilling well. Surveys of the tide gauge site are performed regularly to account for any settling of the site. Tide gauges may also move vertically with the region as a result of post-glacial rebound, tectonic uplift or crustal subsidence. This greatly complicates the problem of determining global sea level change from tide gauge data. Differences in global sea level estimates from tide gauge data usually reflect the investigator's approach in considering these vertical crustal movements. Tide gauges also monitor meteorological factors that affect sea levels, such as barometric pressure and wind speed, so that these variable factors can be eliminated from long-term assessments of sea level change. Although the global network of tide gauges comprises of a poorly distributed sea level measurement system, it offers the only source of historical, precise, long-term sea level data. Major conclusions from tide gauge data have been that global sea level has risen approximately 10-25 cm during the past century.

Tide Gauge Estimates of Mean Sea Level Rise
Estimates of global sea level rise which were derived from tide gauge records are found in the table below. Most of the investigators reported that the estimated values were sensitive to the choice of record length and the tide gauges selected. This sensitivity coupled with different computational techniques and modeling would certainly explain some of the differences shown below.
Error (mm/yr) Data Used (years) # of Tide GaugesReferences
Sea Level Rise (mm/yr)
|
Sea Level Rise (mm/yr) |
Error (mm/yr) | Data Used (years) | # of Tide Gauges | References |
| 2.8 | ±0.8 | 1993-2009 | ~200 | Church & White (2011) |
| 1.7 | ±0.2 | 1900-2009 | >38 since 1900 | Church & White (2011) |
| 1.9 | ±0.4 | 1961-2009 | >190 since 1960 | Church & White (2011) |
| 1.43 | ±0.14 | 1881-1980 | 152 | Barnett (1984) |
| 2.27 | ±0.23 | 1930-1980 | 152 | Barnett (1984) |
| 1.2 | ±0.3 | 1880-1982 | 130 | Gornitz and Lebedeff (1987) |
| 2.4 | ±0.9 | 1920-1970 | 40 | Peltier and Tushingham (1989) |
| 1.75 | ±0.13 | 1900-1979 | 84 | Trupin and Wahr (1990) |
| 1.7 | ±0.5 | N/A | N/A | Nakiboglu and Lambeck (1991) |
| 1.8 | ±0.1 | 1880-1980 | 21 | Douglas (1991) |
| 1.62 | ±0.38 | 1807-1988 | 213 | Unal and Ghil (1995) |